The gravity of the events of recent weeks stemming from the highly publicized killings of several black citizens, including George Floyd, Ahmaud Arbery, Breonna Taylor, and Rayshard Brooks, has led for a call to acknowledge and respond to systemic racism in the United States. Initially, the focus was on the actions of the police, but the call to action has grown, asking Americans to address inequities based on race as a whole within our country. That begs the question, is race a factor in the child welfare system? The answer is yes.
A Look at Who the Children Are in North Carolina’s Child Welfare System*
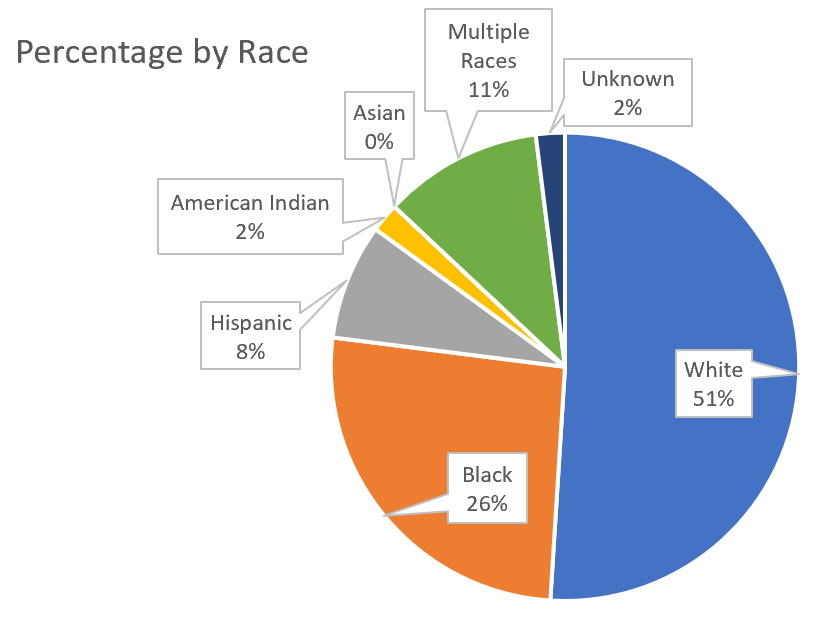
In North Carolina in 2018, there were over 17,000 children in foster care. The charts below show that the likelihood of being involved in the child welfare system is impacted by race. Breaking down the total number of children in foster care in North Carolina by race, the percentages are as follows.
The proportionality of the percentage of children in North Carolina who are involved with the child welfare system (whether substantiated for abuse, neglect, or dependency or placed in foster care) by a particular race to the percentage of the general population of children in North Carolina based on that race shows that disparities exist. The table below illustrates the disproportionality for both substantiated cases of abuse, neglect, or dependency, not all of which result in a foster care placement, and a child’s placement in foster care.
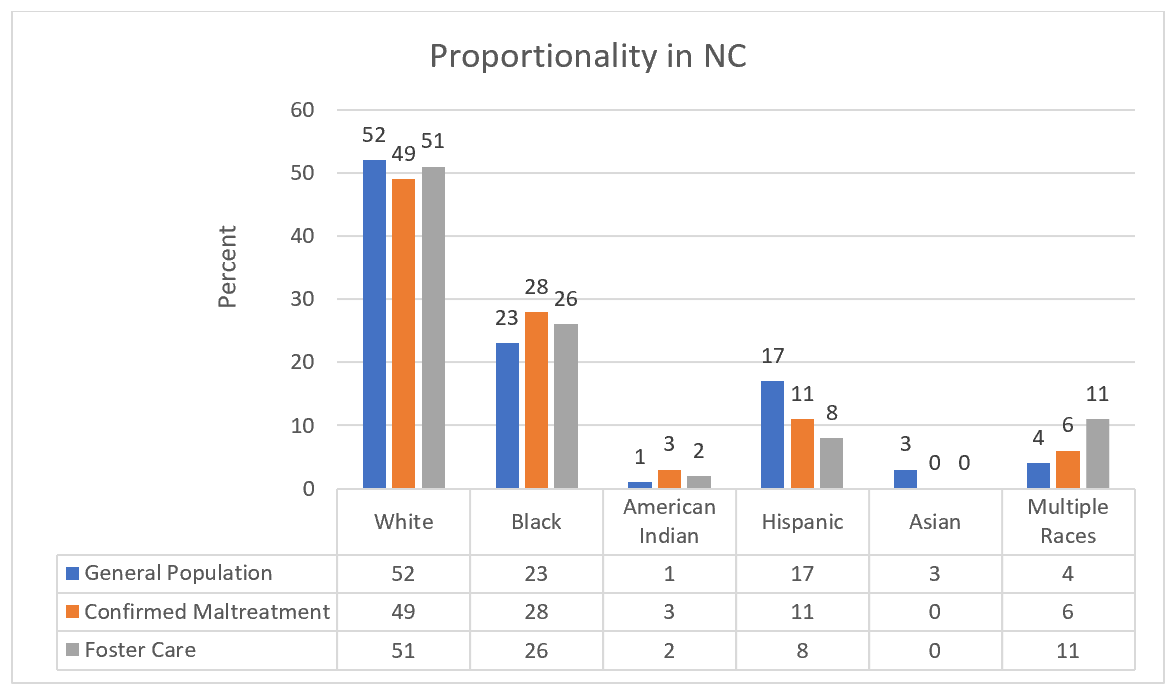
An examination of this table shows that children who are Black, American Indian, and of more than one race are disproportionally represented in North Carolina’s child welfare system. Children who are White, Hispanic, and Asian are underrepresented in that system.
A National Look at Who the Children Are in Foster Care*
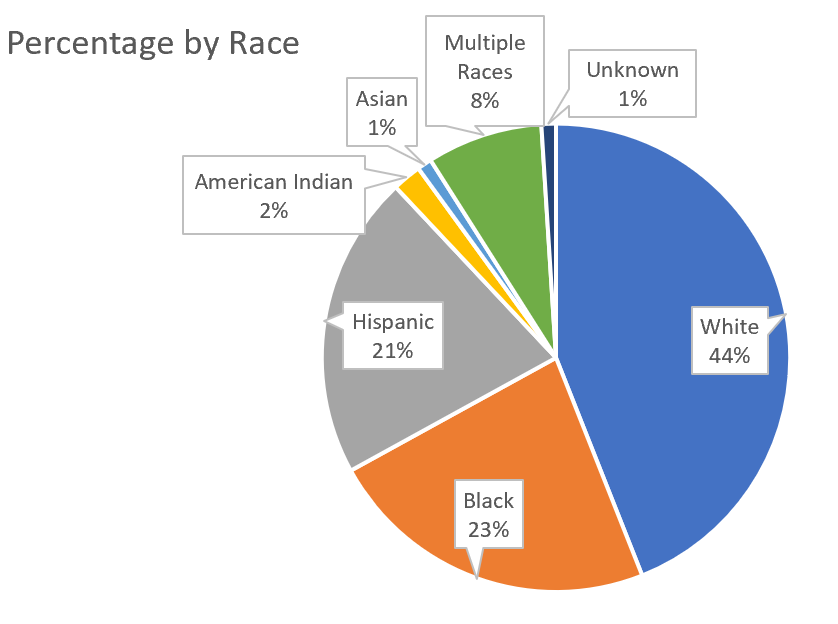
North Carolina is not unique in the disproportionality by race of children involved in the child welfare system. In 2018, there were over 435,000 children in foster care in the United States. Breaking down the total number of children in foster care by race, the percentages are as follows.
 As with the North Carolina data, the proportionality of the percentage of children in foster care by a particular race when compared to the percentage of children of that particular race to all children in the general population shows that disparities exist. The table below illustrates these differences.
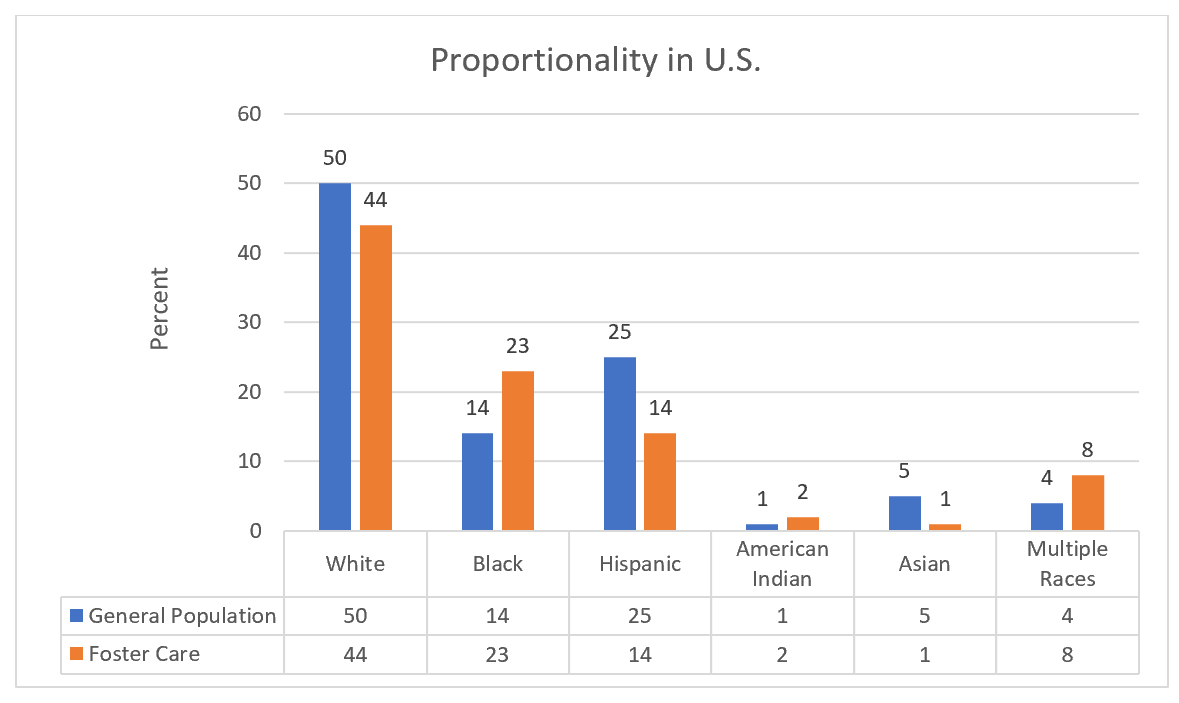
This table mirrors North Carolina’s data in showing that children who are Black, American Indian, and of more than one race are disproportionally represented in the foster care system. Children who are White, Hispanic, and Asian are underrepresented in the foster care system.
Beyond the Numbers: Congressional Recognition
The numbers do not tell the whole story. One can also look to the enactment of various federal anti-discrimination laws based on race, color, and national origin.
As early as 1978, Congress recognized that race played a significant role in child protective services, with an examination of how American Indian and Alaska Native children were treated throughout the states. In response, Congress enacted the Indian Child Welfare Act (ICWA) to address discriminatory practices in the child protection and adoption services systems. One of the Congressional findings in ICWA explicitly states “that an alarmingly high percentage of Indian families are broken up by the removal, often unwarranted, of their children from them by nontribal public and private agencies and that an alarmingly high percentage of such children are placed in non-Indian foster and adoptive homes and institutions.” 25 U.S.C.A. § 1901(4). ICWA is a federal law that establishes minimum standards that must be applied in foster care (abuse, neglect, dependency); termination of parental rights; and adoption proceedings when an “Indian child” is the subject of that action. The law addresses standards for removal, placement preferences, the provision of active efforts to the family, and the tribe’s involvement in the proceeding. See 25 U.S.C. 1901-1963; 25 C.F.R. Part 23.
In 1994, Congress enacted the Multiethnic Placement Act (MEPA) and amended that Act in 1996 with the Removal of Barriers to Interethnic Adoption Provisions (IEP) in the Small Business Job Protection Act. MEPA-IEP is an anti-discrimination law that focuses on race, color, and national origin. This federal law is designed to (1) prevent discrimination in the placement of children in foster care or for adoption on the basis of race, color, or national origin; (2) decrease the length of time that children wait to be adopted; and (3) facilitate the identification and recruitment of a diverse pool of foster and adoptive parents.
Additionally, although not specific to child welfare, Title VI of the Civil Rights Act of 1964 is a federal law that prohibits discrimination on the basis of race, color, or national origin by any program or activity that receives federal financial assistance. As related to child welfare in North Carolina, the NC Department of Health and Human Services, the county departments of social services, child-placing agencies, the court system, and programs administered through the Administrative Office of the Courts all receive federal financial assistance making Title VI applicable to them. In child welfare, much of the focus of the implementation of Title VI is based on national origin and the provision of language access services (e.g., interpreters and translation of documents) to non-English speakers. However, the statute also prohibits discrimination on the basis of race or color.
As with all laws, these federal laws must be implemented to be effective. That requires all the parties to the child welfare system – NC DHHS, county departments of social services, the courts, parent and respondent attorneys, and the children’s attorney advocates – to seek their implementation and enforcement.
NC Department of Health and Human Services Child Welfare Policy
In addition to the federal laws themselves, guidance is provided in the Cross Functions section of the NC DHHS Division of Social Services Child Welfare Manual. There are sections that discuss
- “Enhanced Practice for Working with Special Populations,” with direction for social workers to be culturally and environmentally sensitive and to recognize their own attitudes and prejudices;
- “The Impact of Cultural Diversity,” which encourages the recognition of cross-cultural differences and provides guidelines for social work practice to be culturally sensitive; and
- Guidelines for implementation of ICWA and MEPA.
The Harder Question: Why Is There Disproportionality?*
The numbers show that Black, American Indian, and children of 2 or more races are overly represented in the child protective system, both nationally and in North Carolina. One can consider a number of possible reasons. For example,
- Perhaps the child welfare system itself is biased, resulting in higher numbers of reports, substantiations, and court actions resulting in foster care placement;
- Black and American Indian children live in high poverty areas at a significantly higher rate than White and Hispanic children: 21% of American Indian children and 20% of Black children in North Carolina compared to 3% of White children;
- Black and American Indian children and children of 2 or more races live in poverty at a significantly higher rate than White children in North Carolina: 23% of American Indian children, 31% of Black children, and 21% of children of 2 more races compared to 11% of White children;
- Children who are Black or are of more than one race live in single-parent households at a disproportionate rate to children who are White in North Carolina: 66% of Black children and 46% of children of 2 or more races compared to 24% of White children.
Why do these differences exist? These are some of the issues to consider to address race-based disproportionality in the child welfare system. Without doing so, the disproportionality will continue.
*The data in this post is from the Annie E. Casey Foundation, Kids Count Data Center.